FortiSIEM Implementation: Centralizing and Visualizing Security Intelligence
As part of strengthening our organization's security posture and improving visibility into network activities, I recently led the successful implementation of FortiSIEM (Security Information and Event Management). The project focused on centralized log collection across the infrastructure, real-time monitoring, and dashboard configuration to streamline incident response and enhance operational awareness.
Project Objectives
- Centralize logging from network devices, servers, applications, and security appliances.
- Enable real-time threat detection, correlation, and alerting.
- Provide actionable insights through customizable dashboards.
- Lay the foundation for compliance reporting and forensic investigation.
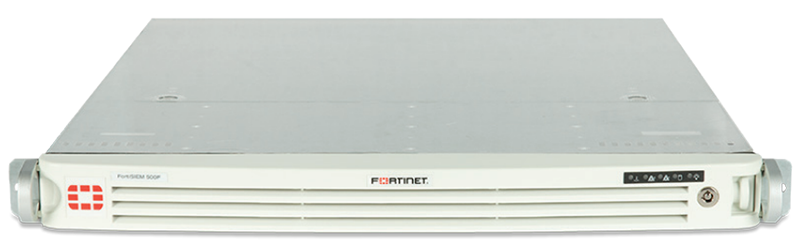
1. FortiSIEM Deployment and Architecture
I deployed FortiSIEM in a distributed architecture, ensuring scalability and optimal performance:
- Supervisor Node: Installed as the central engine for data analysis, correlation, and UI access.
- Collectors/Agents: Deployed on strategic points within the network to gather logs from various sources (firewalls, endpoints, servers, cloud apps).
- Integrated with Fortinet security devices, as well as third-party firewalls, operating systems, and applications using syslog, SNMP, and API connectors.
2. Log Collection and Integration
I configured log collection policies and ensured proper ingestion from:
- Network infrastructure (firewalls, switches, routers)
- Servers (Windows Event Logs, Linux Syslogs)
- Endpoint protection platforms
- Application servers and cloud services (where applicable)
Log parsing rules were fine-tuned to ensure high-fidelity data ingestion, supporting accurate correlation and analysis.
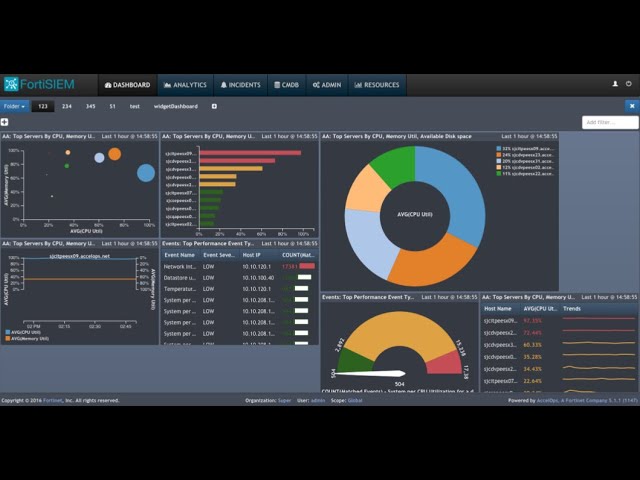
3. Dashboards and Visualization
Once the log streams were fully integrated, I focused on building custom dashboards tailored for different operational roles:
- Security Operations Dashboard: Real-time threat alerts, failed login attempts, privilege escalation events.
- Network Overview Dashboard: Bandwidth usage, traffic anomalies, and device availability.
- System Health Dashboard: CPU, memory, disk usage trends for critical systems.
These dashboards provide at-a-glance visibility, allowing for proactive response and quick decision-making in the event of anomalies or threats.
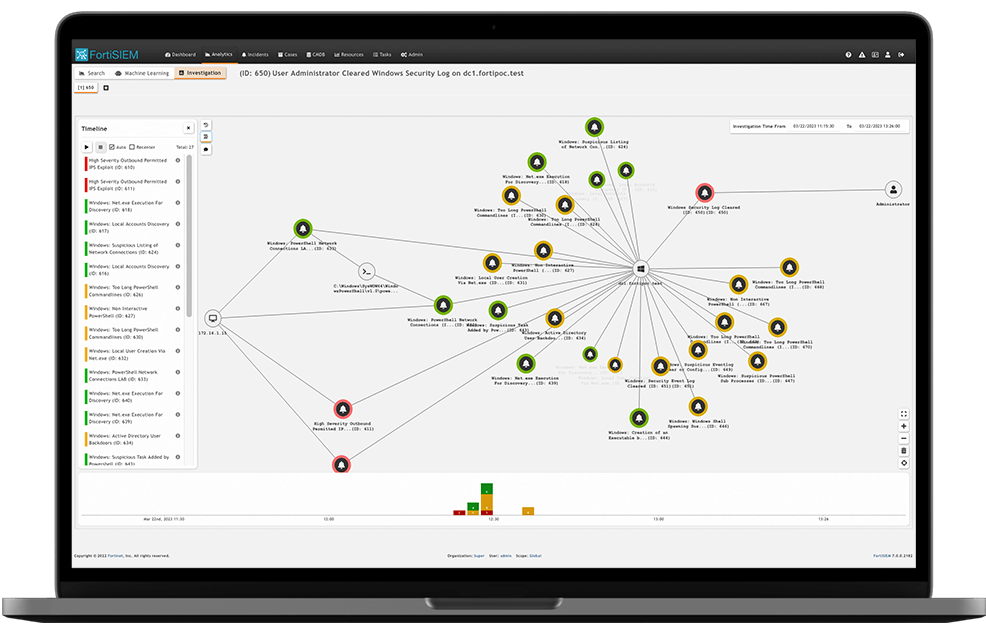
4. Alerts and Correlation Rules
- I configured correlation rules to detect suspicious patterns such as brute force attacks, lateral movement, or unusual login activity.
- Set up alerts with email and dashboard notifications for critical events, ensuring fast response from relevant teams.
- Integrated alerting with a ticketing system for proper incident tracking and resolution.
5. Benefits and Next Steps
- Centralized visibility into security events and operational data.
- Faster incident detection and reduced response time.
- A scalable platform ready to support compliance audits and advanced analytics.
Next steps include tuning correlation rules further, expanding coverage to additional log sources, and enabling user behavior analytics (UBA) to detect insider threats.
Conclusion
The FortiSIEM implementation has significantly enhanced our organization's ability to detect, investigate, and respond to security incidents in real time. By consolidating logs and visualizing key operational parameters through dashboards, we've laid the foundation for a smarter and more proactive security operations strategy.